
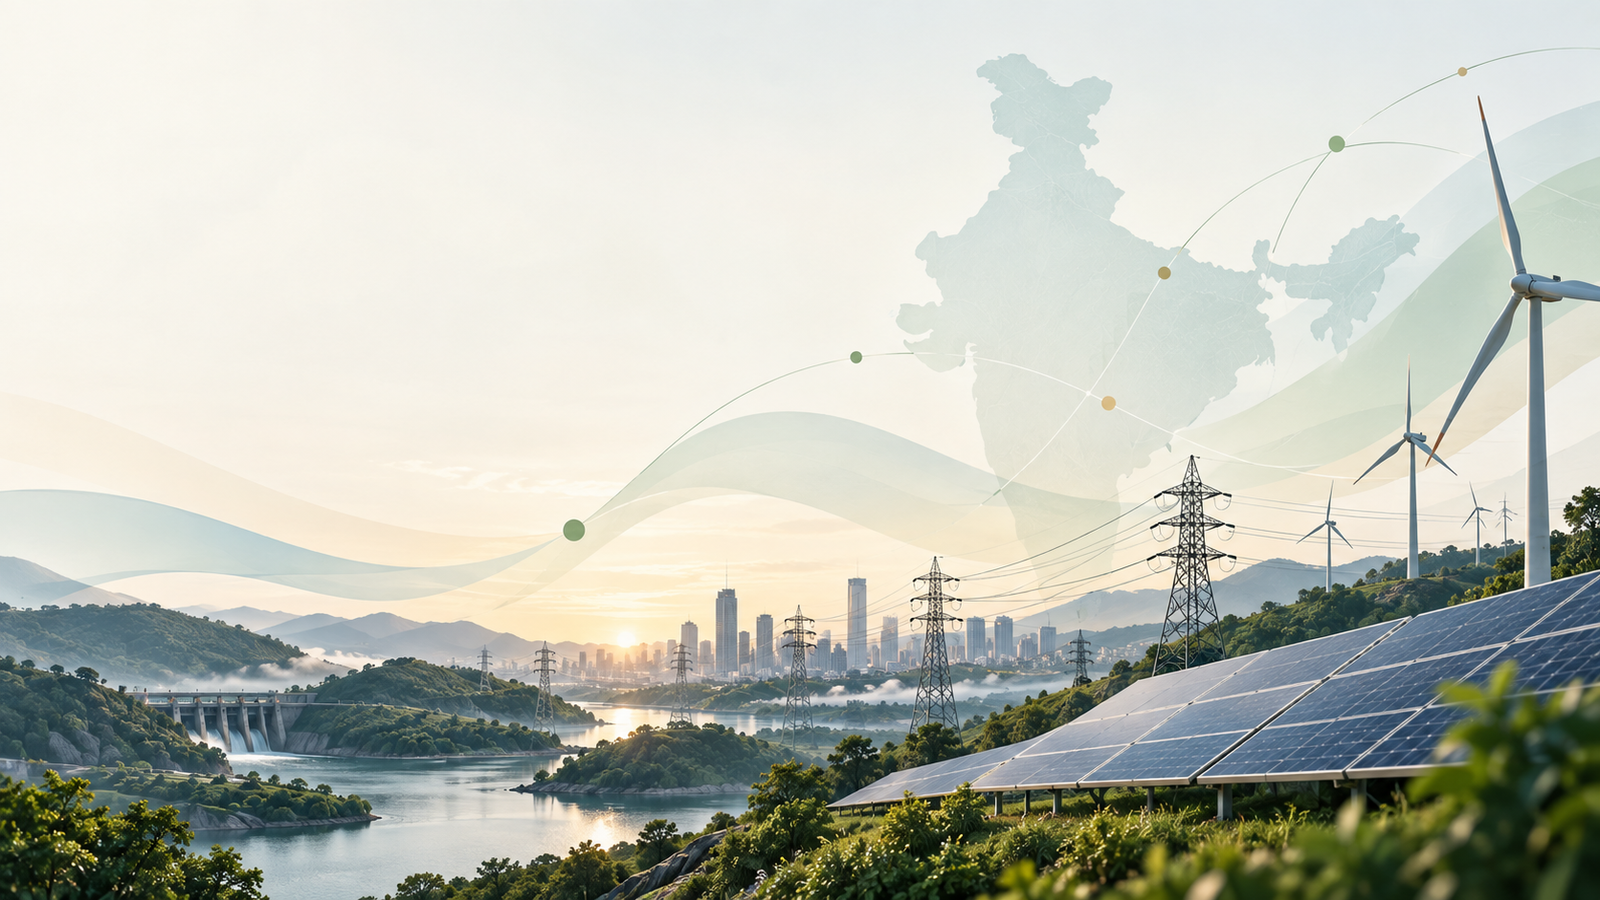
India’s Clean Energy Pivot: Decarbonizing the Grid for Viksit Bharat
Reader's Note on Electricity Metrics: Installed Capacity (GW / MW): Measures instantaneous generation potential. 1 GW (Gigawatt) = 1,000 MW (Megawatts). Energy Output / Generation (BU / MU): Measures actual electrical energy produced over time. 1 Unit = 1 kilowatt-hour (kWh); 1 MU (Million Units) = 1 million kWh; and 1 BU (Billion Units) = 1 billion kWh (or 1 Terawatt-hour, TWh).
Grid Architecture: Renewables Command the Majority of Installed Capacity
For decades, coal-fired thermal generation formed the indispensable backbone of India's electrification. While coal remains critical for baseload requirements at 230.78 GW (41.81%), clean generation technologies now constitute the clear numerical majority of national generation assets.
Clean energy capacity stands at 291.73 GW out of an aggregate national installed capacity of 551.99 GW as on July 31, 2026 (Central Electricity Authority).
Solar energy represents the largest and fastest-growing constituent of this capacity. Within total renewable capacity, solar accounts for 164.59 GW (29.82% of the entire grid), followed by wind power at 58.14 GW (10.53%), large hydro at 52.06 GW (9.43%), bio-power and waste-to-energy at 11.75 GW (2.13%), and small hydro at 5.18 GW (0.94%). Data from the International Renewable Energy Agency (IRENA) underscores the steep trajectory of this buildout: India’s per-capita renewable generating capacity grew from 59.2 Watts per person in 2015 to 140.9 Watts per person in 2024, driven by an expansion from 90.41 GW in 2016 to over 250.50 GW by year-end 2025.
Generation Realities: Clean Power Supplies Over 30% of Monthly Electricity
A common operational critique of renewable capacity additions has been the divergence between nameplate capacity and actual generation. However, seasonal generation tracking shows that clean power is meeting a substantial share of the country's daily load curve.
Clean energy sources accounted for 30.82% of India's total electricity generation of 182.52 BU in July 2026, marking a 3.21% year-on-year increase in RE generation (CEA).
Wind and solar power operated in close tandem during July 2026, together supplying nearly two-thirds of total renewable generation. Strong monsoon wind patterns pushed wind generation to 18,505.00 MU (32.90% of RE generation), while solar output reached 18,082.30 MU (32.15%), representing a massive 49.43% year-on-year increase in solar output compared to July 2025 (12,100.61 MU). On a cumulative basis for FY 2026–27 (April to July 2026), India generated 194.07 BU of renewable electricity (27.50% of total generation), with solar contributing 80.87 BU and wind contributing 52.07 BU.
Geographic Concentration: The Western and Southern Renewable Hubs
The geographical expansion of clean energy is heavily concentrated in states with high-solar-irradiance corridors and coastal wind assets. Data from the Ministry of New & Renewable Energy (MNRE) as of August 31, 2026, shows that two western states, Gujarat and Rajasthan, host over 35% of the country's total renewable power capacity.
Gujarat leads the nation in installed clean energy capacity, closely followed by Rajasthan at 50.72 GW (MNRE, August 2026).
Rajasthan remains the nation's solar anchor with 44.37 GW installed, including 38.90 GW in large ground-mounted parks such as Bhadla and Nokh. Gujarat possesses a balanced dual-resource portfolio, pairing 34.88 GW of solar (including 8.15 GW of rooftop installations) with a nation-leading 16.72 GW of onshore wind infrastructure. In the southern region, Tamil Nadu (30.05 GW) and Karnataka (27.87 GW) offer grid balancing through balanced deployments of wind, solar, and hydro resources.
The Viksit Bharat Strategy: System Integration and Emissions Reduction
Achieving the economic velocity required for Viksit Bharat without a proportionate surge in greenhouse gas emissions requires resolving intermittency challenges. As variable renewable generation peaks during daylight and monsoon hours, India's power planning has evolved toward hybrid parks and round-the-clock (RTC) supply models.
Key initiatives modernising the grid include:
- Hybrid Solar-Wind Deployments: Co-locating wind turbines and solar PV arrays along shared evacuation corridors in Gujarat and Rajasthan to smooth seasonal and diurnal supply fluctuations.
- Inter-State Green Energy Corridors: Massive transmission lines linking high-resource generation zones in Khavda, Bikaner, and Fatehgarh to industrial consumption hubs across the central and northern demand centres.
- Decentralised Rooftop Scaling: Under schemes such as PM-Surya Ghar Muft Bijli Yojana, national rooftop solar capacity expanded to 32.60 GW by late August 2026, shifting generation directly to domestic consumer load points.
- Off-Grid Renewable Infrastructure: International tracking by IRENA shows that India's off-grid renewable capacity surpassed 5.39 GW by 2025 (generating over 13.43 TWh in 2024), providing clean irrigation through solar water-pumping programs such as PM-KUSUM.
By surpassing 52.8% non-fossil capacity and delivering over 30% of its monthly electricity from renewable sources, India is demonstrating that emerging industrial economies can expand manufacturing output while decoupling gross domestic product growth from carbon emissions.
- Central Electricity Authority (CEA), Ministry of Power, Government of India. (July 2026). Monthly Renewable Energy Generation Report: July 2026. New Delhi.
- Central Electricity Authority (CEA), Ministry of Power, Government of India. (July 2026). Broad Overview of Monthly Renewable Energy Generation: July 2026. New Delhi.
- Ministry of New & Renewable Energy (MNRE), Government of India. (August 2026). State-wise Installed Capacity of Renewable Power as on 31.08.2026. New Delhi.
- International Renewable Energy Agency (IRENA). (2026). Renewable Energy Statistics 2026. Abu Dhabi: IRENA.
Get our research and event invitations
Subscribe for new publications, workshops, and policy commentary from The Research Wise.
India’s Escalating Climate Anomalies and the New Thermal Reality
Driven by systemic baseline shifts, India's meteorological profile is fracturing under the weight of escalatin...
Read More →
The Shrinking Urban-Rural Consumption Gap: A Converging Indian Economy
India's rural and urban consumption habits are converging rapidly. The urban-rural gap in average monthly per...
Read More →