
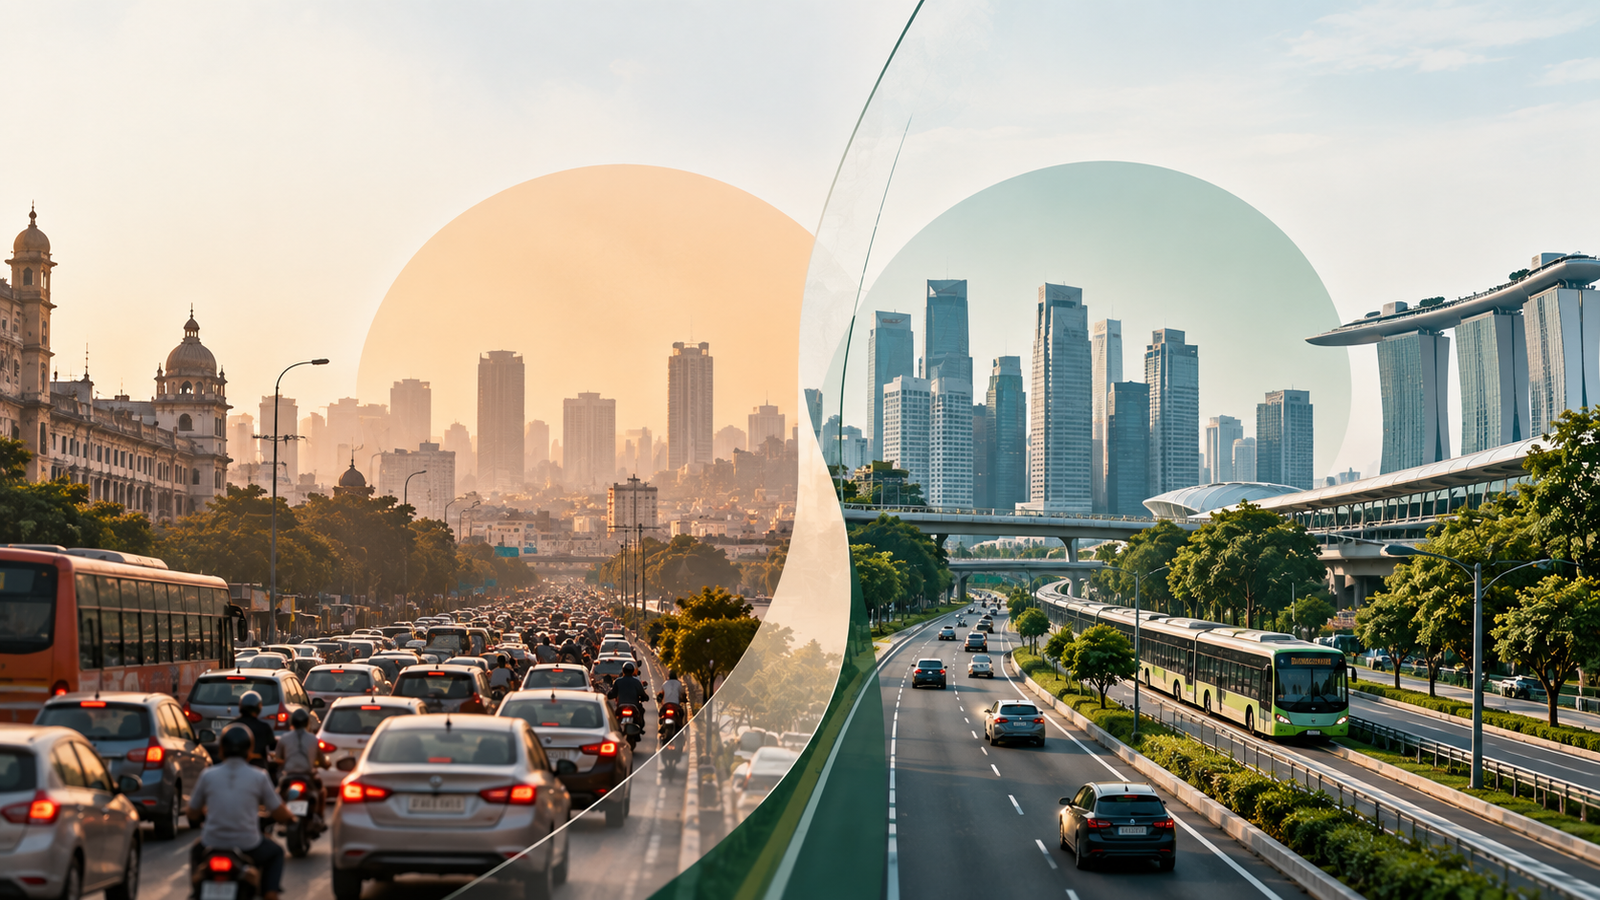
Can India Learn From Singapore’s Success on Traffic Management?
Gridlock in the Metros: 10 Kilometers Takes Over Half an Hour
The concentration of commercial activities and motorised vehicles on constrained rights-of-way has severely impaired mobility across India’s tier-1 cities. Kolkata and Bengaluru lead the country in travel delays, with average travel times per 10 kilometres exceeding 34 minutes.
Productive work hours lost to traffic delays across India's top metropolitan centres cause an estimated annual economic loss of $22 billion.
Even planned administrative centres and tech corridors show pronounced traffic distress. In Pune (33 min 22 sec) and Hyderabad (31 min 30 sec), chronic congestion directly undermines regional productivity, increases logistics costs, and elevates fuel consumption.
Demographic Headwinds: Urban Population Projected to Reach 877 Million by 2050
The underlying driver of recurring traffic jams is rapid urban migration coupled with an unprecedented surge in personal motorisation. According to the World Resources Institute (WRI), India’s urban population grew from 25.9 million in 1901 to 377.1 million in 2011.
Projections from the UN World Urbanisation Prospects indicate India's cities will accommodate 877 million residents by 2050, more than doubling the 2015 urban footprint.
As urban centres expand, vehicle ownership has surged exponentially. Data from the Ministry of Road Transport and Highways (MoRTH) Road Transport Yearbook 2019–2020 indicates that registered motor vehicles per 1,000 population rose from 53 in 2001 to 246 in 2020, nearly a fivefold increase. Cars and motorised two-wheelers now account for over 85% of all active vehicular traffic, saturating arterial corridors.
The Transit Deficit: An Absence of Reliable Public Transportation
The dependency on personal vehicles is largely a response to severe shortfalls in municipal bus networks and mass transit infrastructure. Lower-income urban residents face acute mobility challenges, while middle-class commuters default to two-wheelers and private cars due to unreliable public transport.
India maintains a low ratio of just 1.2 public buses per 1,000 people, leaving formal transit inaccessible to large portions of urban travellers.
According to NITI Aayog (2018), only 63 of India’s 458 cities with populations over 100,000 operate a formal municipal bus network. Furthermore, metro rail services operate in only 13 cities, while suburban rail services operate in 9. While auto-rickshaws, app-based cabs, and intermediate minibuses fill part of this void, the absence of high-capacity, dedicated-lane public transport accelerates road congestion.
Policy Architecture: Adapting Singapore’s Playbook for Indian Metros
Singapore’s traffic governance succeeds because it curbs congestion at the source through clear market mechanisms, price signals, and transit prioritisation:
- Certificate of Entitlement (COE) & Vehicle Quota System (VQS): Implemented in 1990, the VQS establishes a hard cap on net vehicle additions and allocates ownership licenses through market auctions with 10-year validity periods to match road-carrying capacity.
- Dynamic Electronic Road Pricing (ERP): By utilising automated overhead gantries and shoulder pricing, tolls adjust upward just before peak travel hours and downward immediately after, maintaining optimal free-flow speeds across central districts.
- Dedicated Transit Corridors: Prioritising designated bus-only lanes ensures mass transit consistently outpaces private vehicles during rush hours, incentivising ridership.
Indian cities have initiated localised technological experiments. In Indore, municipal authorities introduced a 14-foot-tall automated traffic robot ("Robocop") equipped with Wi-Fi surveillance cameras, a public address system, and automated e-challan enforcement for traffic violations. Additionally, Indore’s "Traffic Mitra Mahaabhiyan" trains citizen volunteers to assist traffic police at busy intersections during weekend peak hours (5:30–8:30 PM), thereby improving compliance and managing bottlenecks.
However, localised interventions cannot substitute for systemic demand management. As Singapore transitions toward ERP 2.0, utilising satellite-based tolling and AI-synchronised traffic lights, India must move beyond supply-side road widening. A comprehensive strategy combining congestion charges in dense commercial districts, strict registration caps for second vehicles, and large-scale expansions of the public bus fleet provides the only viable roadmap toward sustainable urban mobility.
- Ministry of Road Transport and Highways (MoRTH), Government of India. (2020). Road Transport Yearbook 2019–2020. New Delhi.
- NITI Aayog. (2018). Transforming India’s Mobility: A Perspective. Government of India, New Delhi.
- TomTom International BV. (2024). TomTom Traffic Index: Annual Global Traffic Congestion Ranking. Amsterdam.
- United Nations, Department of Economic and Social Affairs, Population Division. (2018). World Urbanization Prospects: The 2018 Revision. New York.
Get our research and event invitations
Subscribe for new publications, workshops, and policy commentary from The Research Wise.
India’s Clean Energy Pivot: Decarbonizing the Grid for Viksit Bharat
Driven by rapid solar additions and expanding wind capacity, renewable sources now constitute over 52.8% of In...
Read More →
How Social Media Shaped Gen Z’s Self-Identity Online and Affects Their Mental Health
Social media usage is growing rapidly, reshaping the fabric of the online world and coinciding with a mounting...
Read More →